IOT Coverage Mapping

The Mappers Coverage map is a crowd-sourced effort to build a true-signal coverage map of the Helium IoT Network across the globe. By mapping real-world coverage, network users can understand where sensor deployments are likely to have success connecting to the Helium Network.
Be sure to check out the ongoing conversation in the dedicated #mappers-iot channel on the official Helium Community Discord Server.
Mappers Visualization
From within the Mappers tool, clicking on a green hexagon will allow you to get more information about the coverage available in that region.
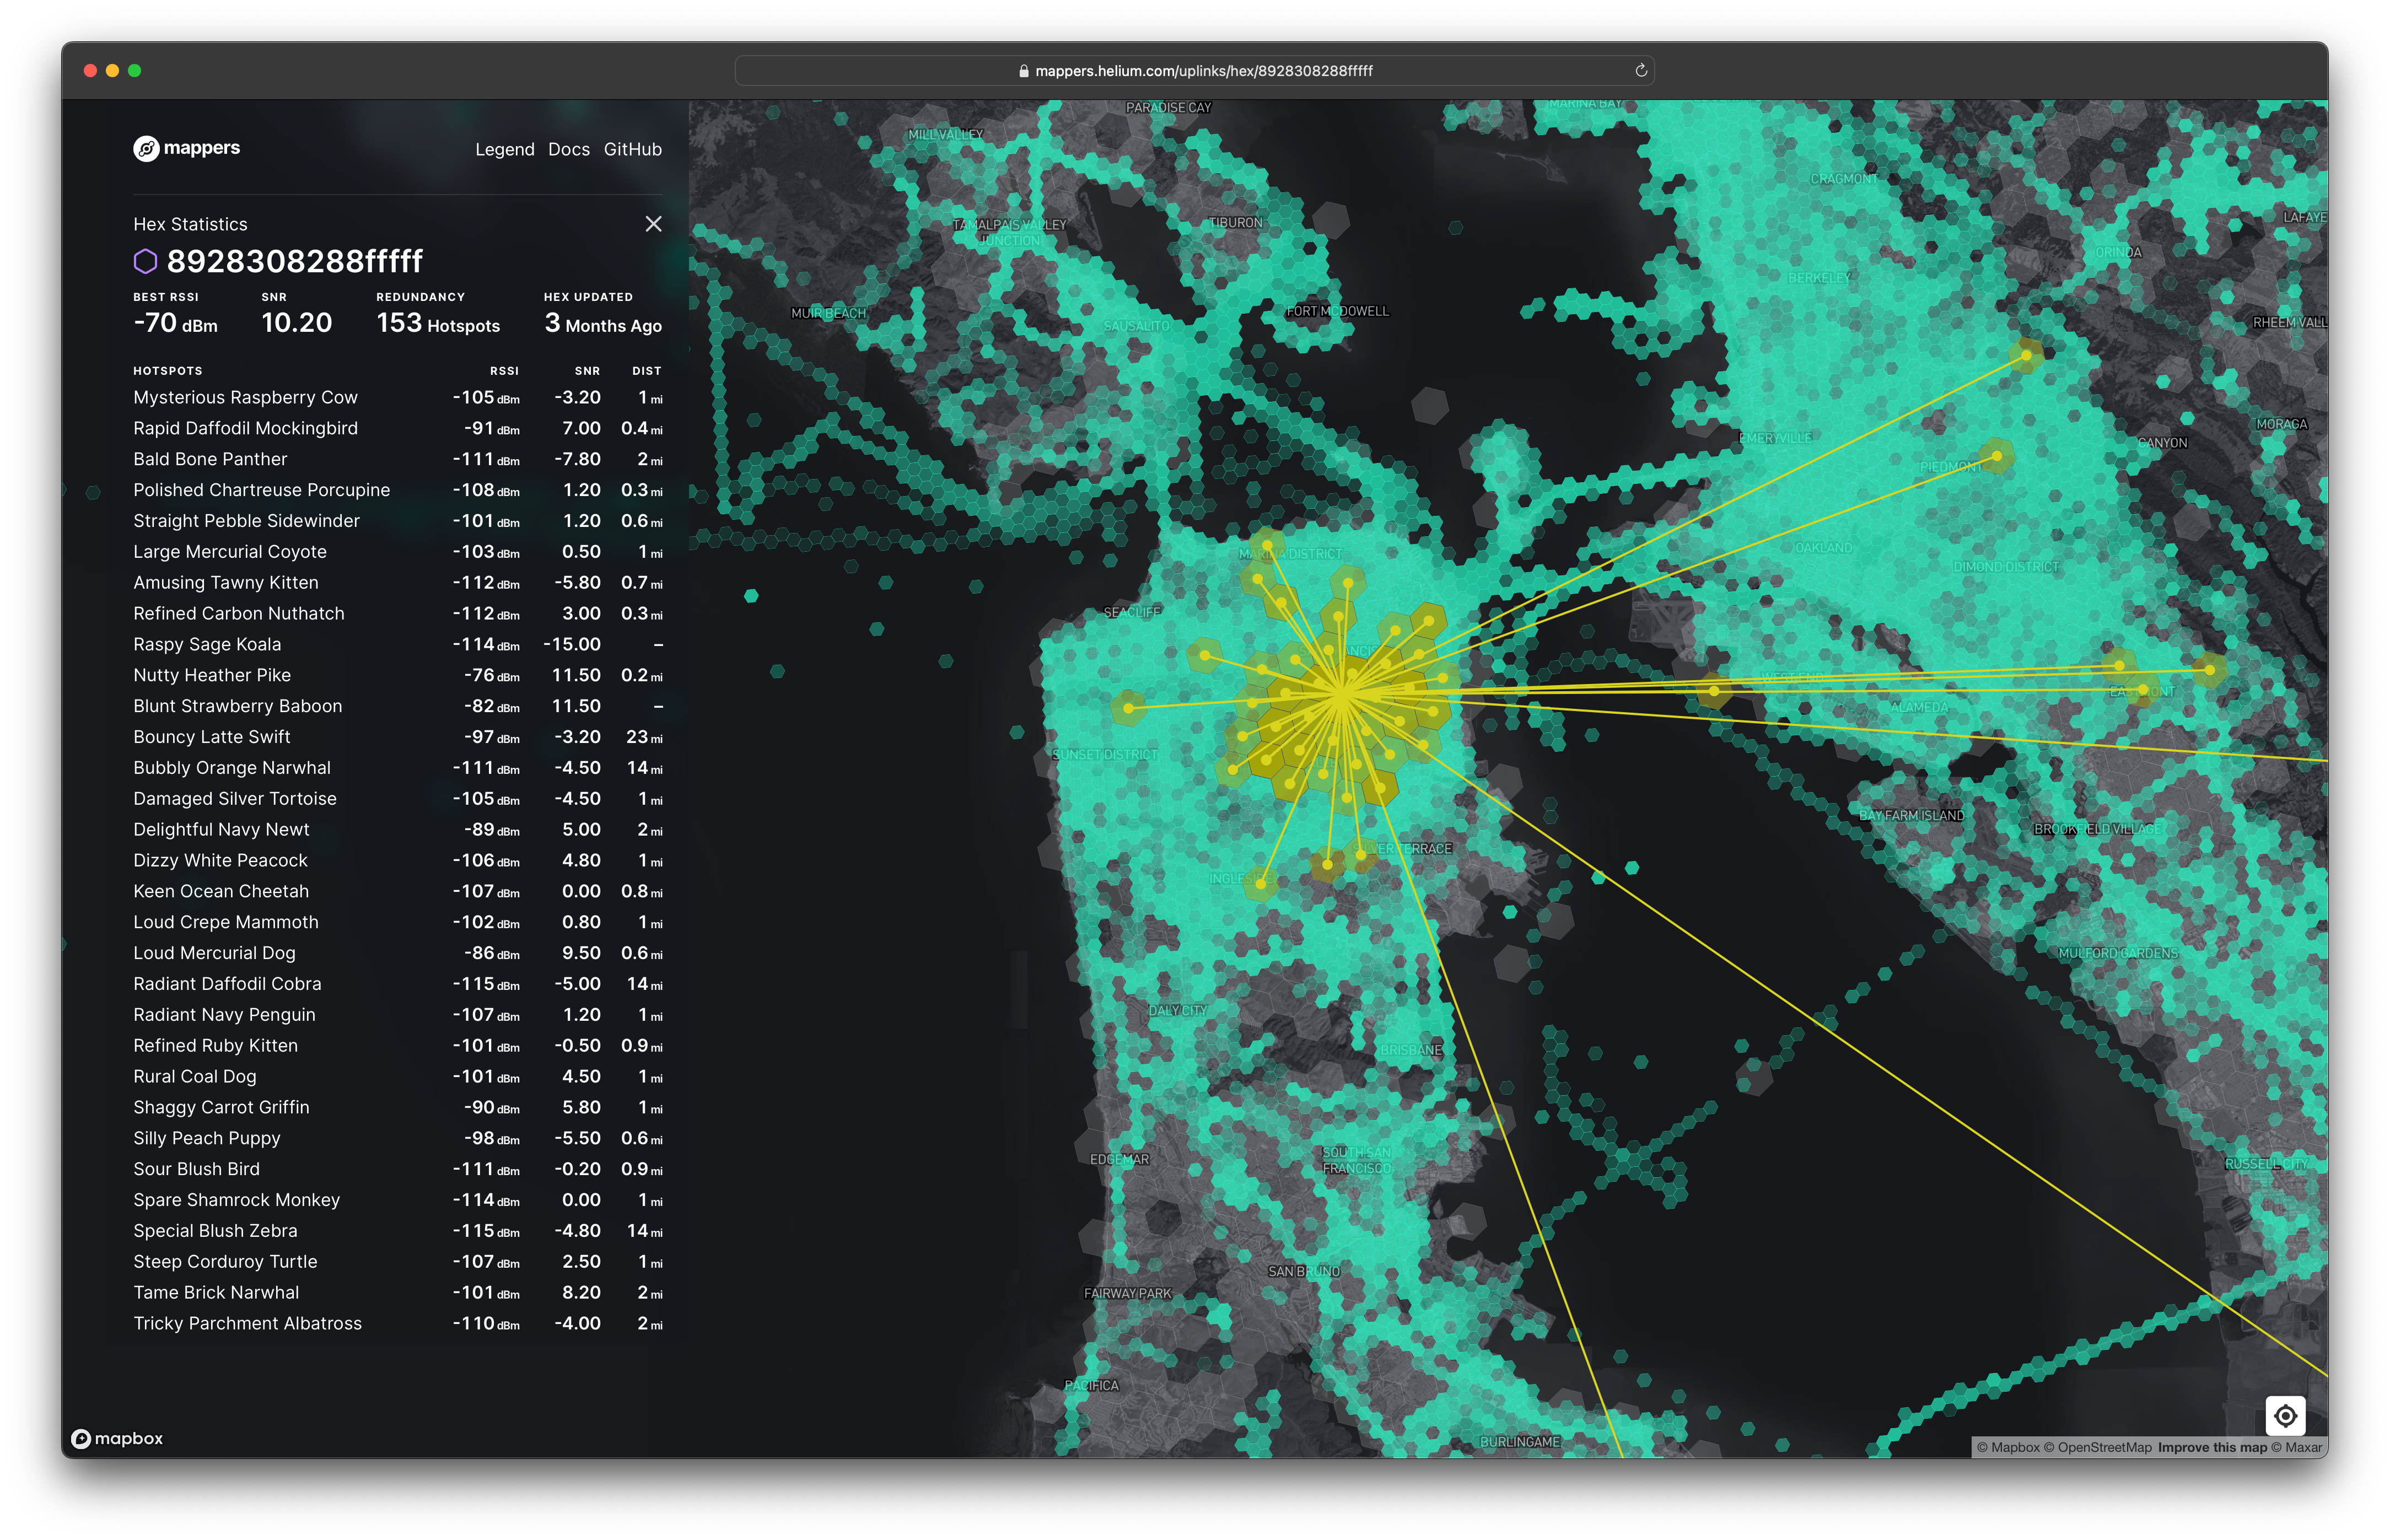
- H3 Index: The funny looking number like
89283082853ffffis the unique H3 index of the hexagon on the map. In other words, it's the hex's name. H3 is a system of managing global datasets and is pervasive throughout different Helium protocols. - RSSI: 'Received Signal Strength Indicator' is a measure of the power present in a received radio signal. This number is computed by the hotspot when it hears the signal from a mapper. The higher the signal (less negative), the 'stronger' it is considered.
- SNR: 'Signal to Noise Ratio' measures the ratio of received power to background power in the received signal. Like the RSSI, it is also computed by the hotspot when it hears signal from the mapper. A higher ratio represents a clear signal whereas a negative number in this field represents a noisy signal.
- Redundancy: The total count of hotspots that heard a mapper from within this hex. This metric is helpful in understanding the resilience of the network in a given area.
- Distance: This is the approximate distance of the mapper from the hotspot that heard it.
Mappers Newsletter
Join the Mappers newsletter to stay up-to-date on new and upcoming features.
Frequently Asked Questions
How does Mappers work?
Participants use low-cost LoRaWAN devices to survey the real-world network created by Helium. Many contributors bring their mapper with them when they walk, hike, bike, drive or even boat! These mappers are small and fit well in a pocket or on a car dash. Some have set up their mappers so they are contributing to the coverage map every time they take a drive.
In order to place a mark on the map, the mapper device sends out a signal with a GPS location encoded. If a Helium Hotspot 'hears' that signal, data is passed through the internet and recorded in the Mappers database. The Mappers database uses the GPS information from the Mapper to 'light up' the hex on the map.
Coverage mapping should only be done from ground level, or slightly above it. The map is designed to indicate the expected coverage a standard sensor device would experience. Data from GPS trackers on a balloon or aircraft should not be contributed to the coverage map.
Why should I contribute to Mappers?
There are a variety of ways that Mapping is valuable to both Hotspot owners and network users. For Hotspot owners, the collected data helps to visualize the coverage provided by all Helium Hotspots - identifying areas where coverage is lacking or even where Hotspot placements could be made that would participate in Proof-of-Coverage with other Hotspots. A marked hex on the map indicates that uplink signals from registered Helium LoRaWAN sensors have been proven to be 'heard' by the Helium network somewhere within that hex shaped area.
For network users, the map proves the real-world coverage that Hotspots provide. This is like looking at the Verizon or T-Mobile map when evaluating phone plans, but for business users. This real world evidence at the scale and resolution offered by our map gives prospective network users the information they need to make decisions about their deployments. As an example, this map is what someone like Lime scooters would look to before they sign a contract.
In short, a robust map means high priced customers, which means adoption, which means the network grows and the token value increases.
Do I earn rewards for contributing?
No, coverage mapping is entirely voluntary. To participate in mapping, you will need to spend Data Credits (DCs) to pay for the data transfer that your mapper uses. HNT can be converted to DC to fund device data transfer or DC can be purchased directly through the Data Credits Portal.
Mapping does not make a Hotspot earn more IOT tokens through Proof-of-Coverage. The real value is to prove the network, drive adoption, and increase the purchase of Data Credits by commercial users.
If the Hotspots that you are mapping are your own, those Data Credits are paid back to your Hotspots in the form of IOT. Hotspots earn IOT for data packets they transfer, for mapping or otherwise.
How can I use Mappers for my own Hotspot deployments?
- Find new locations for Hotspots.
- Get real-world information about how far your Hotspot reaches.
- Learn RF data analytics in an interactive way.
How can I use Mappers for my own sensor deployments?
Take a mapping device to the area where you want to deploy sensors and watch to see if it is picked up by a Hotspot in the hex where you want to deploy a sensor. If it's picked up by only one Hotspot, decide if you want to deploy an additional Hotspot in that area for sensor connection redundancy. Look at existing mapped areas for confirmation that your sensors can be deployed in that area and how many Hotspots can pick them up. It only takes one Hotspot to receive and transmit data through the internet, but the redundancy offered by the Helium Network helps to ensure that your data is received.
Other Mapping Projects
Helium Cargo
Cargo is an evaluation tool for LoRaWAN GPS tracking devices. It shows the current location of these devices, along with the coverage of the network as an H3 hex grid. While Helium Mappers shows an aggregate view of the network coverage, Cargo can display specific mapper devices by name, and their most-recent position reports.
View GPS trackers on Cargo at cargo.helium.com.
CoverageMap.net
Coverage Map draws heatmaps for LoRaWAN networks. This tool has the ability to show raw survey results for devices and Hotspots. It aggregates coverage measurements into a heatmap, radar plots and alpha shapes. View Helium's heatmap on this tool at CoverageMap.net.